

The debugging set for MALT has been released
- Details
- Published: Saturday, 15 October 2016 17:48
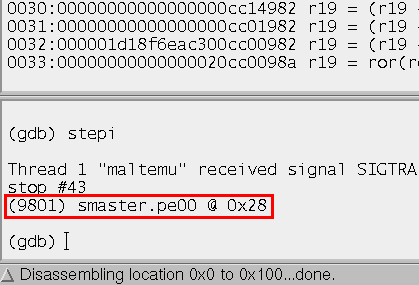 |
Photo: maltsystem.com |
The first version of tool kit for MALT software development and debugging has been released. The kit includes emulator, debugger and profiler. The emulator enables to execute and debug MALT programs on general-purpose computers running under Unix-like systems. The emulator, its integrated GDB debugger and the profiler significantly simplify development and porting programs on MALT system and also make it possible to evaluate the efficiency of algorithm implementation on MALT without running it on real hardware.
MALTemu - MALT hardware emulator designed for running programs in a virtual environment, where hardware components are software-based simulated. MALTemu provides the maximum similarity of key features between simulated equipment and real hardware, along with that, being a tool for development, debugging and performance analysis of developed applied and system software. Emulator programs, used in development, enable to implement program execution trace, software profiling and monitoring.
Software profiler, integrated into MALTemu, collects statistics of simulated time consumed by active processor cores during program execution. The profiler is active when “-p” option is in emulator command line. That's a default option when typical build script is used and “make emu-prof” command is called. Profiling results are saved as “markdown” text file format with table sections sorted by consumed processor time.
